Plotting data using log axis
Plotting in log axis with matplotlib
import matplotlib.pyplot as plt
%matplotlib inline


import numpy as np

x = np.linspace(0.1, 20)
y = 20*np.exp(-x/10.0)
Plotting using the standard function then specifying the axis scale
One of the easiest way to plot in a log plot is to specify the plot normally and then specify which axis is to be plotted with a log scale.
This can be specified by the function set_xscale or set_yscale
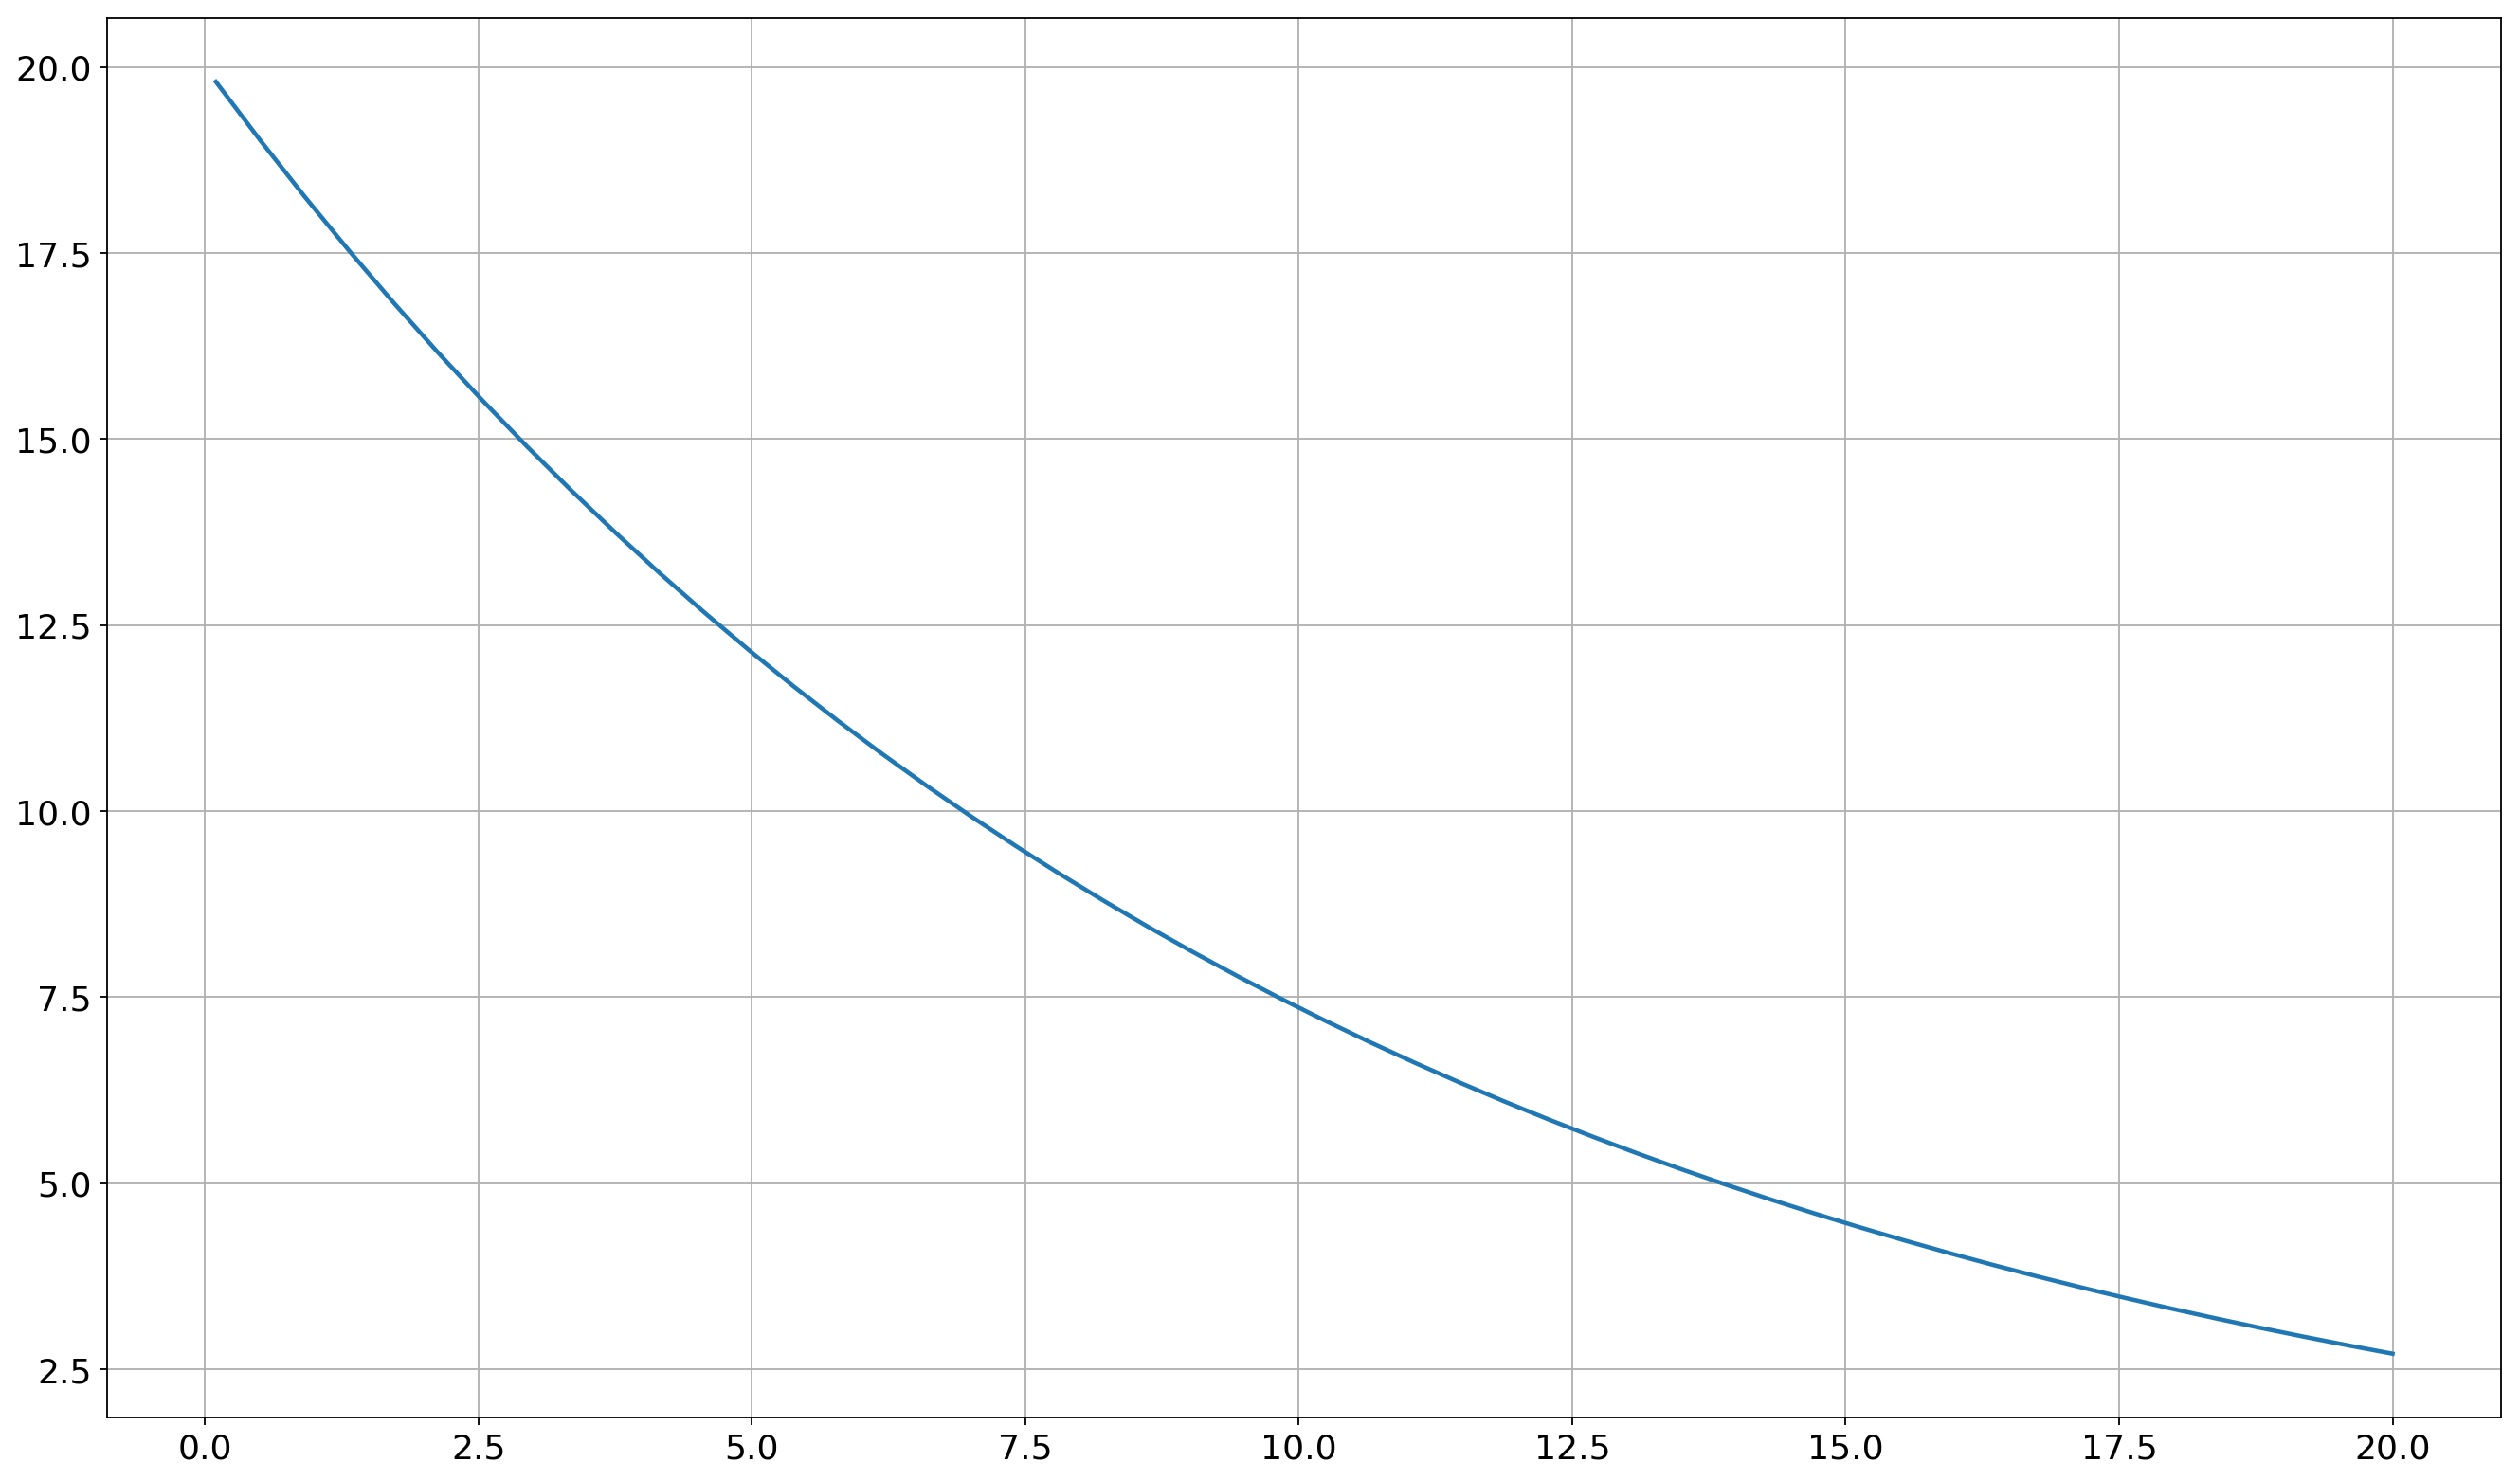
# Normal plot
fig = plt.figure()
ax = fig.add_subplot(1, 1, 1)

ax.plot(x, y)

ax.grid()

plt.show()
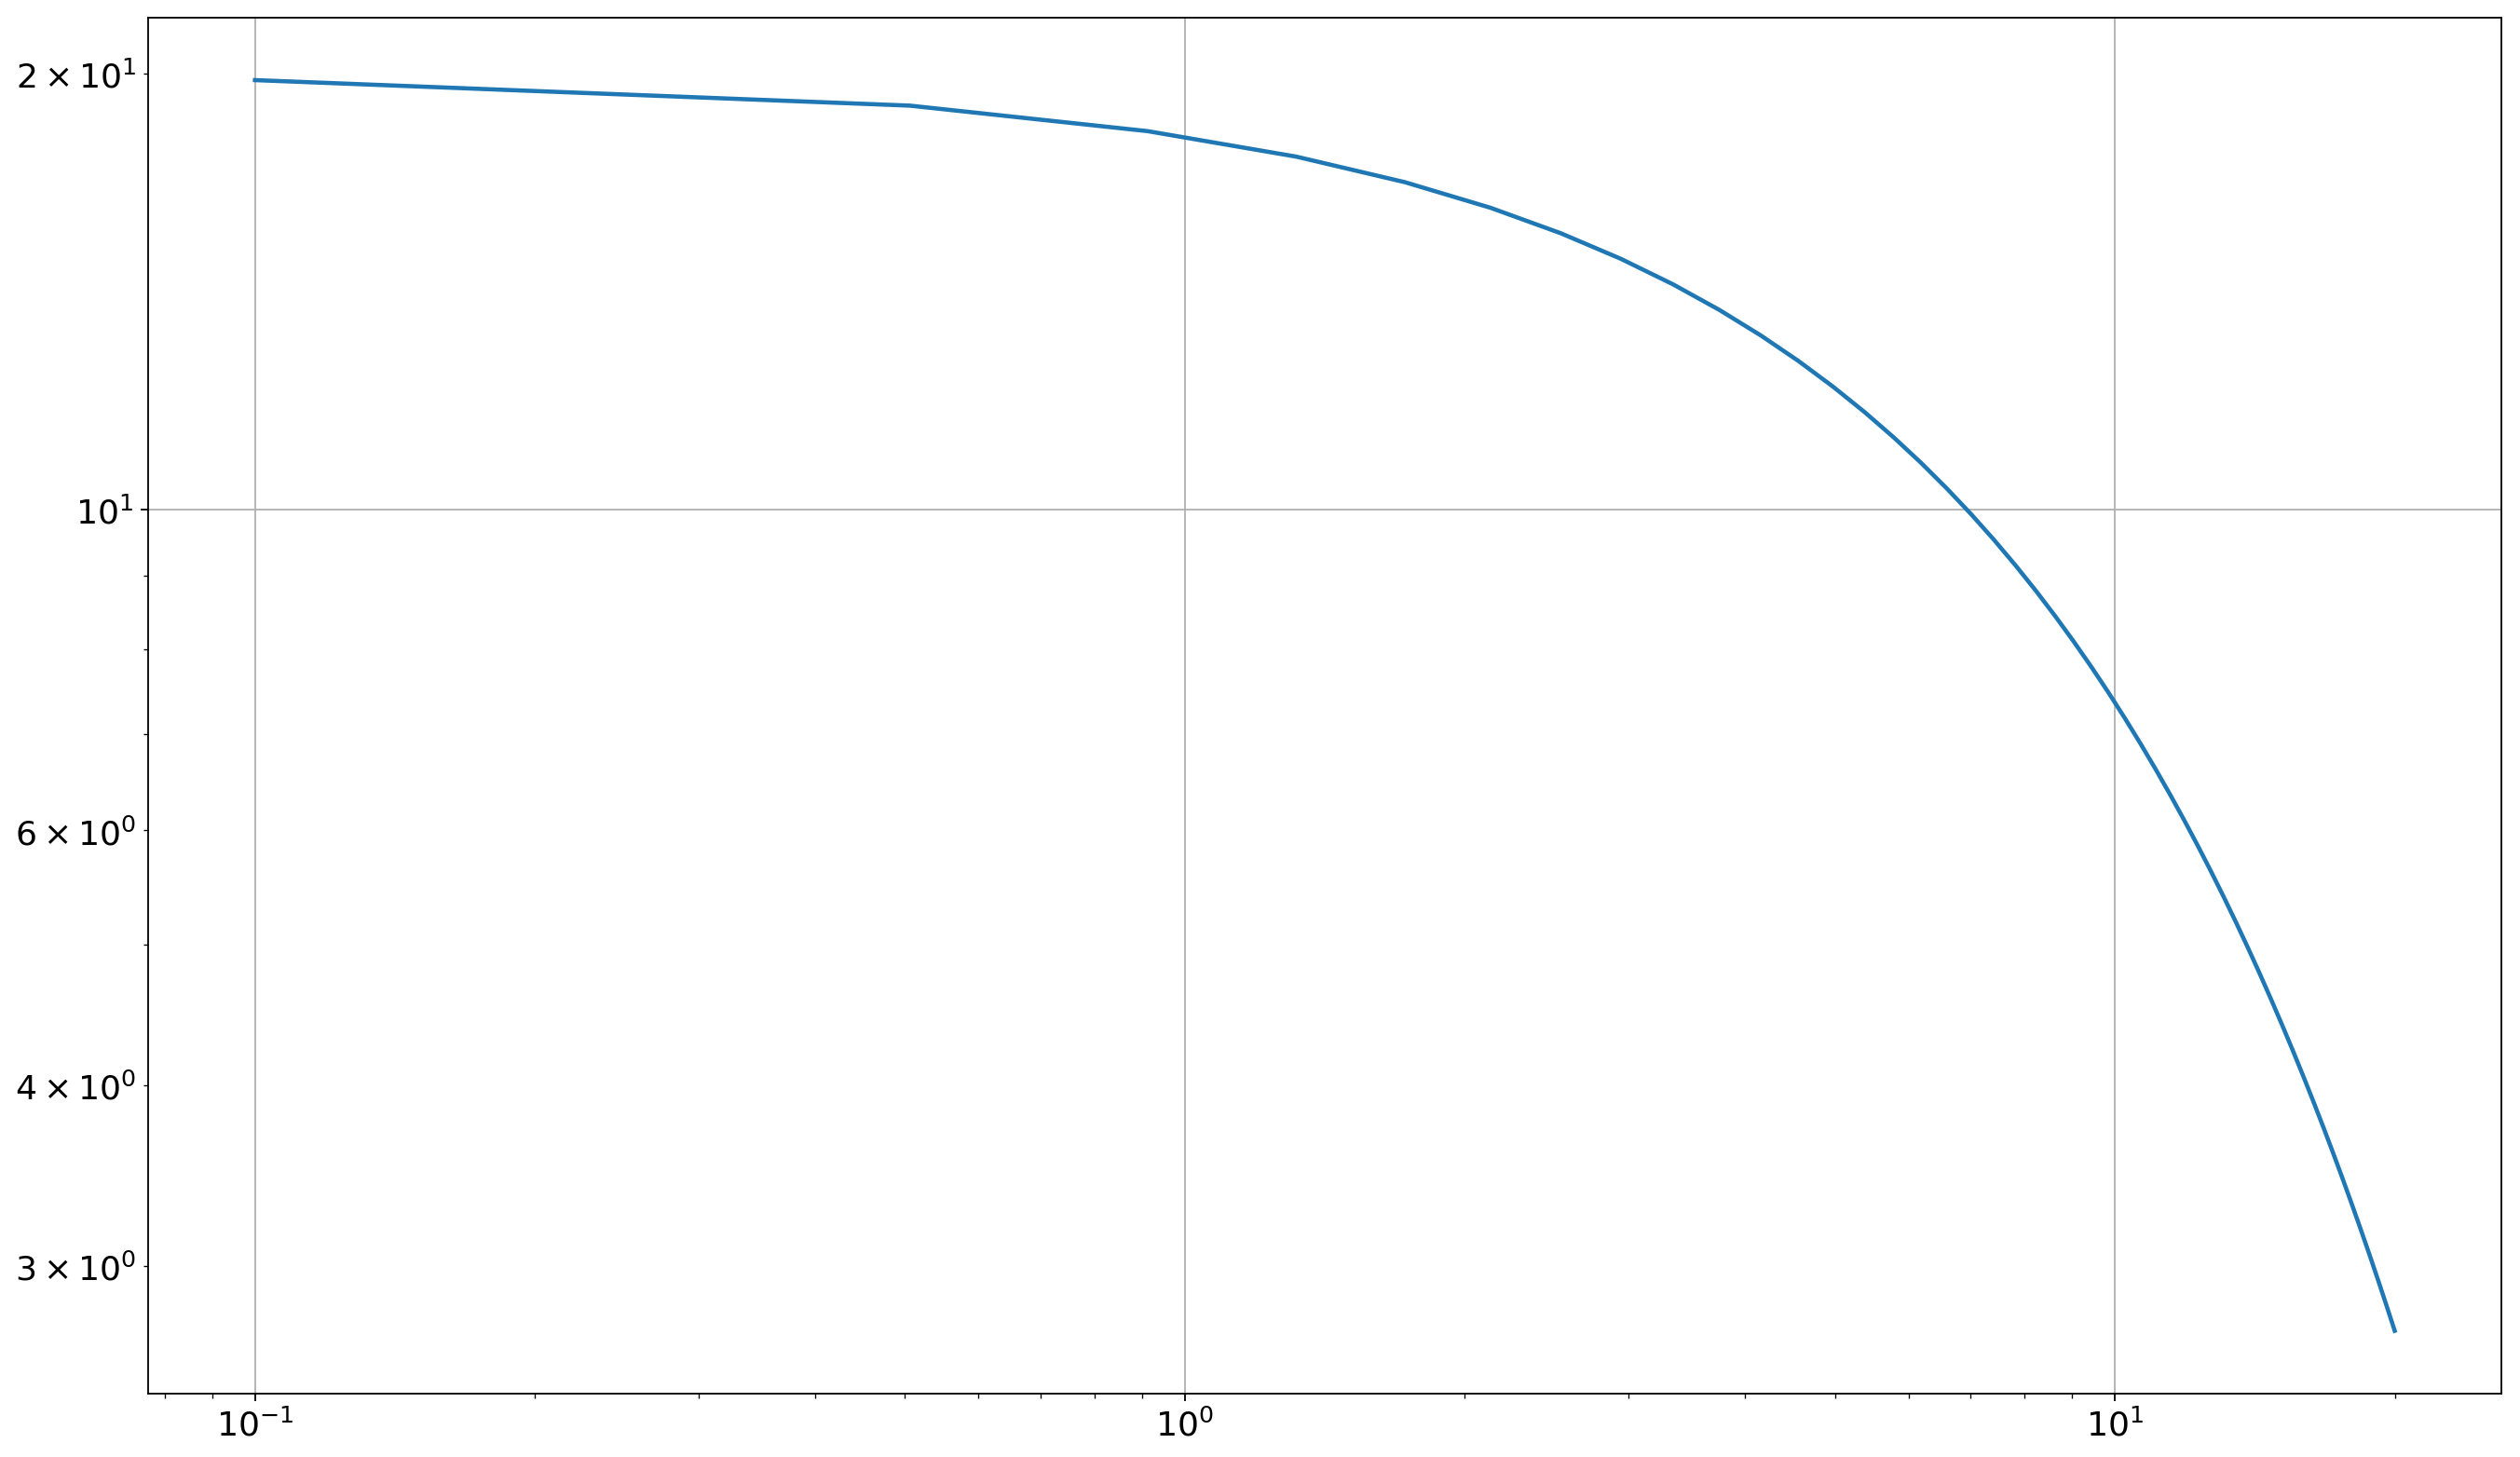
# Log x axis plot
fig = plt.figure()
ax = fig.add_subplot(1, 1, 1)

ax.plot(x, y)

ax.set_xscale('log')
ax.grid()

plt.show()

# Log x axis plot
fig = plt.figure()
ax = fig.add_subplot(1, 1, 1)

ax.plot(x, y)

ax.set_yscale('log')
ax.grid()

plt.show()

# Log x axis plot
fig = plt.figure()
ax = fig.add_subplot(1, 1, 1)

ax.plot(x, y)

ax.set_xscale('log')
ax.set_yscale('log')
ax.grid()

plt.show()

Plotting using the matplotlib defined function
Matplotlib has the function : semilogx, semilogy and loglog that can help you avoid having to specify the axis scale.
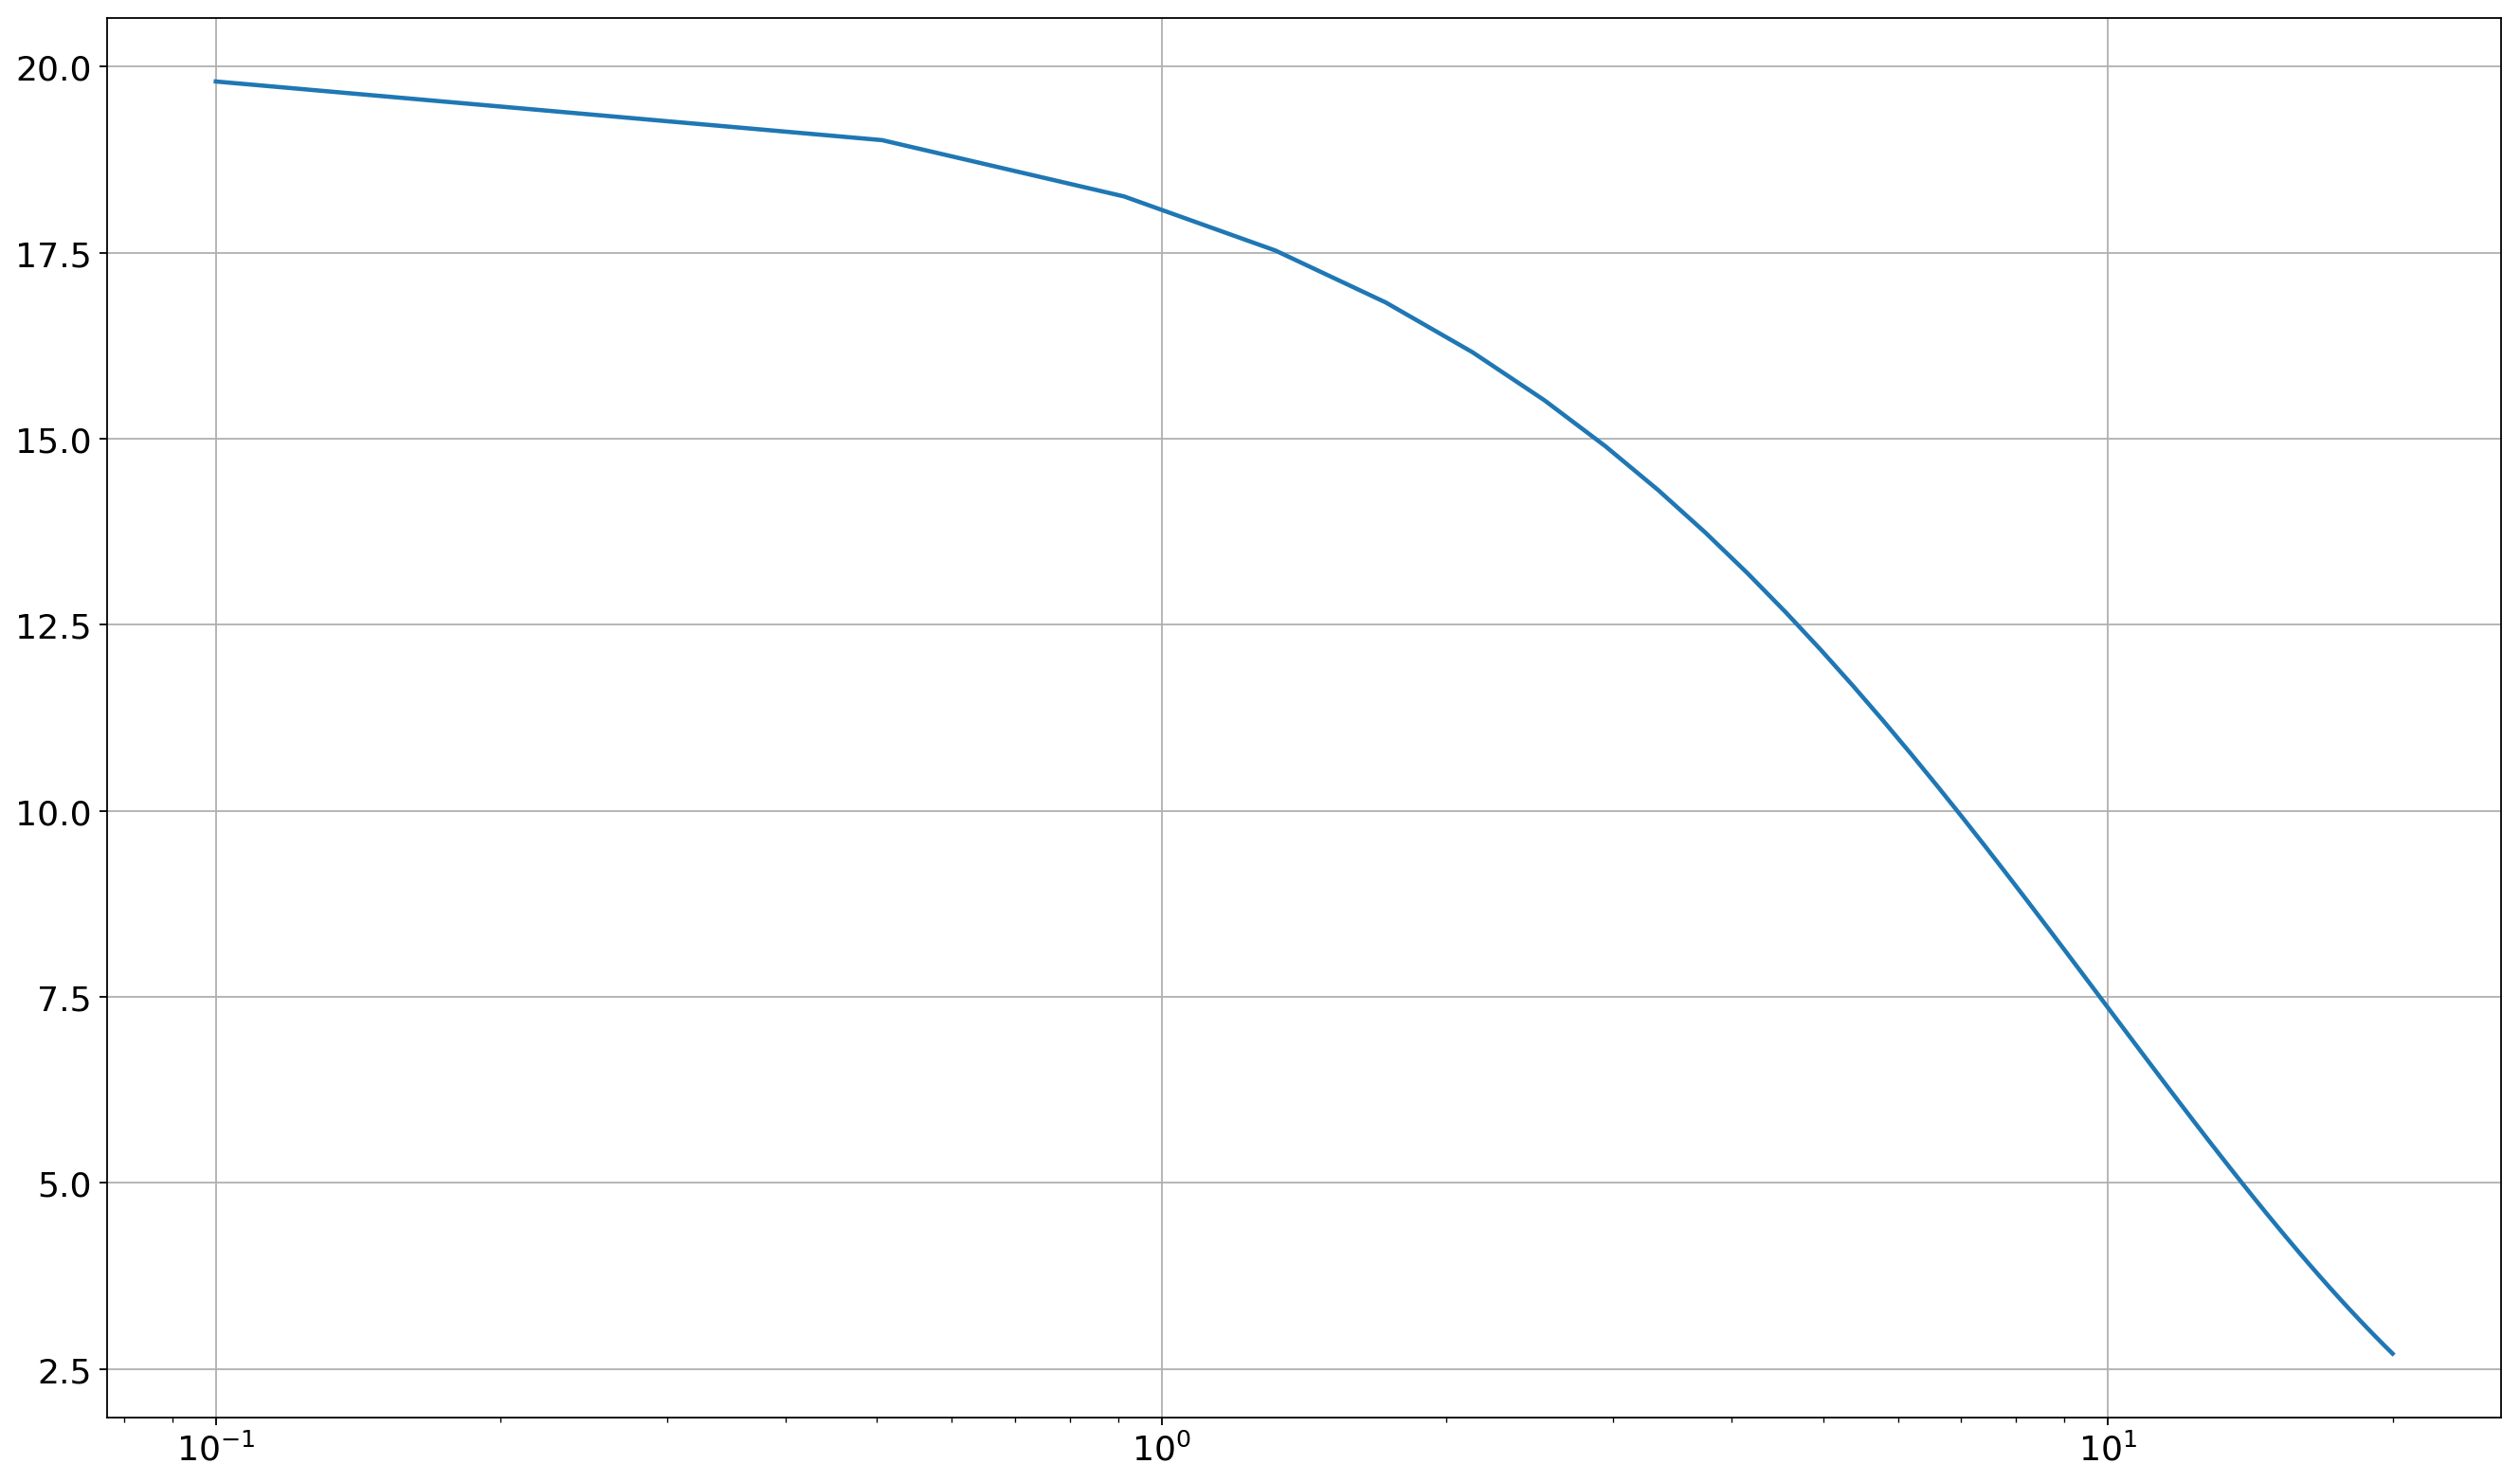
# Plot using semilogx
fig = plt.figure()
ax = fig.add_subplot(1, 1, 1)

ax.semilogx(x, y)

ax.grid()
plt.show()
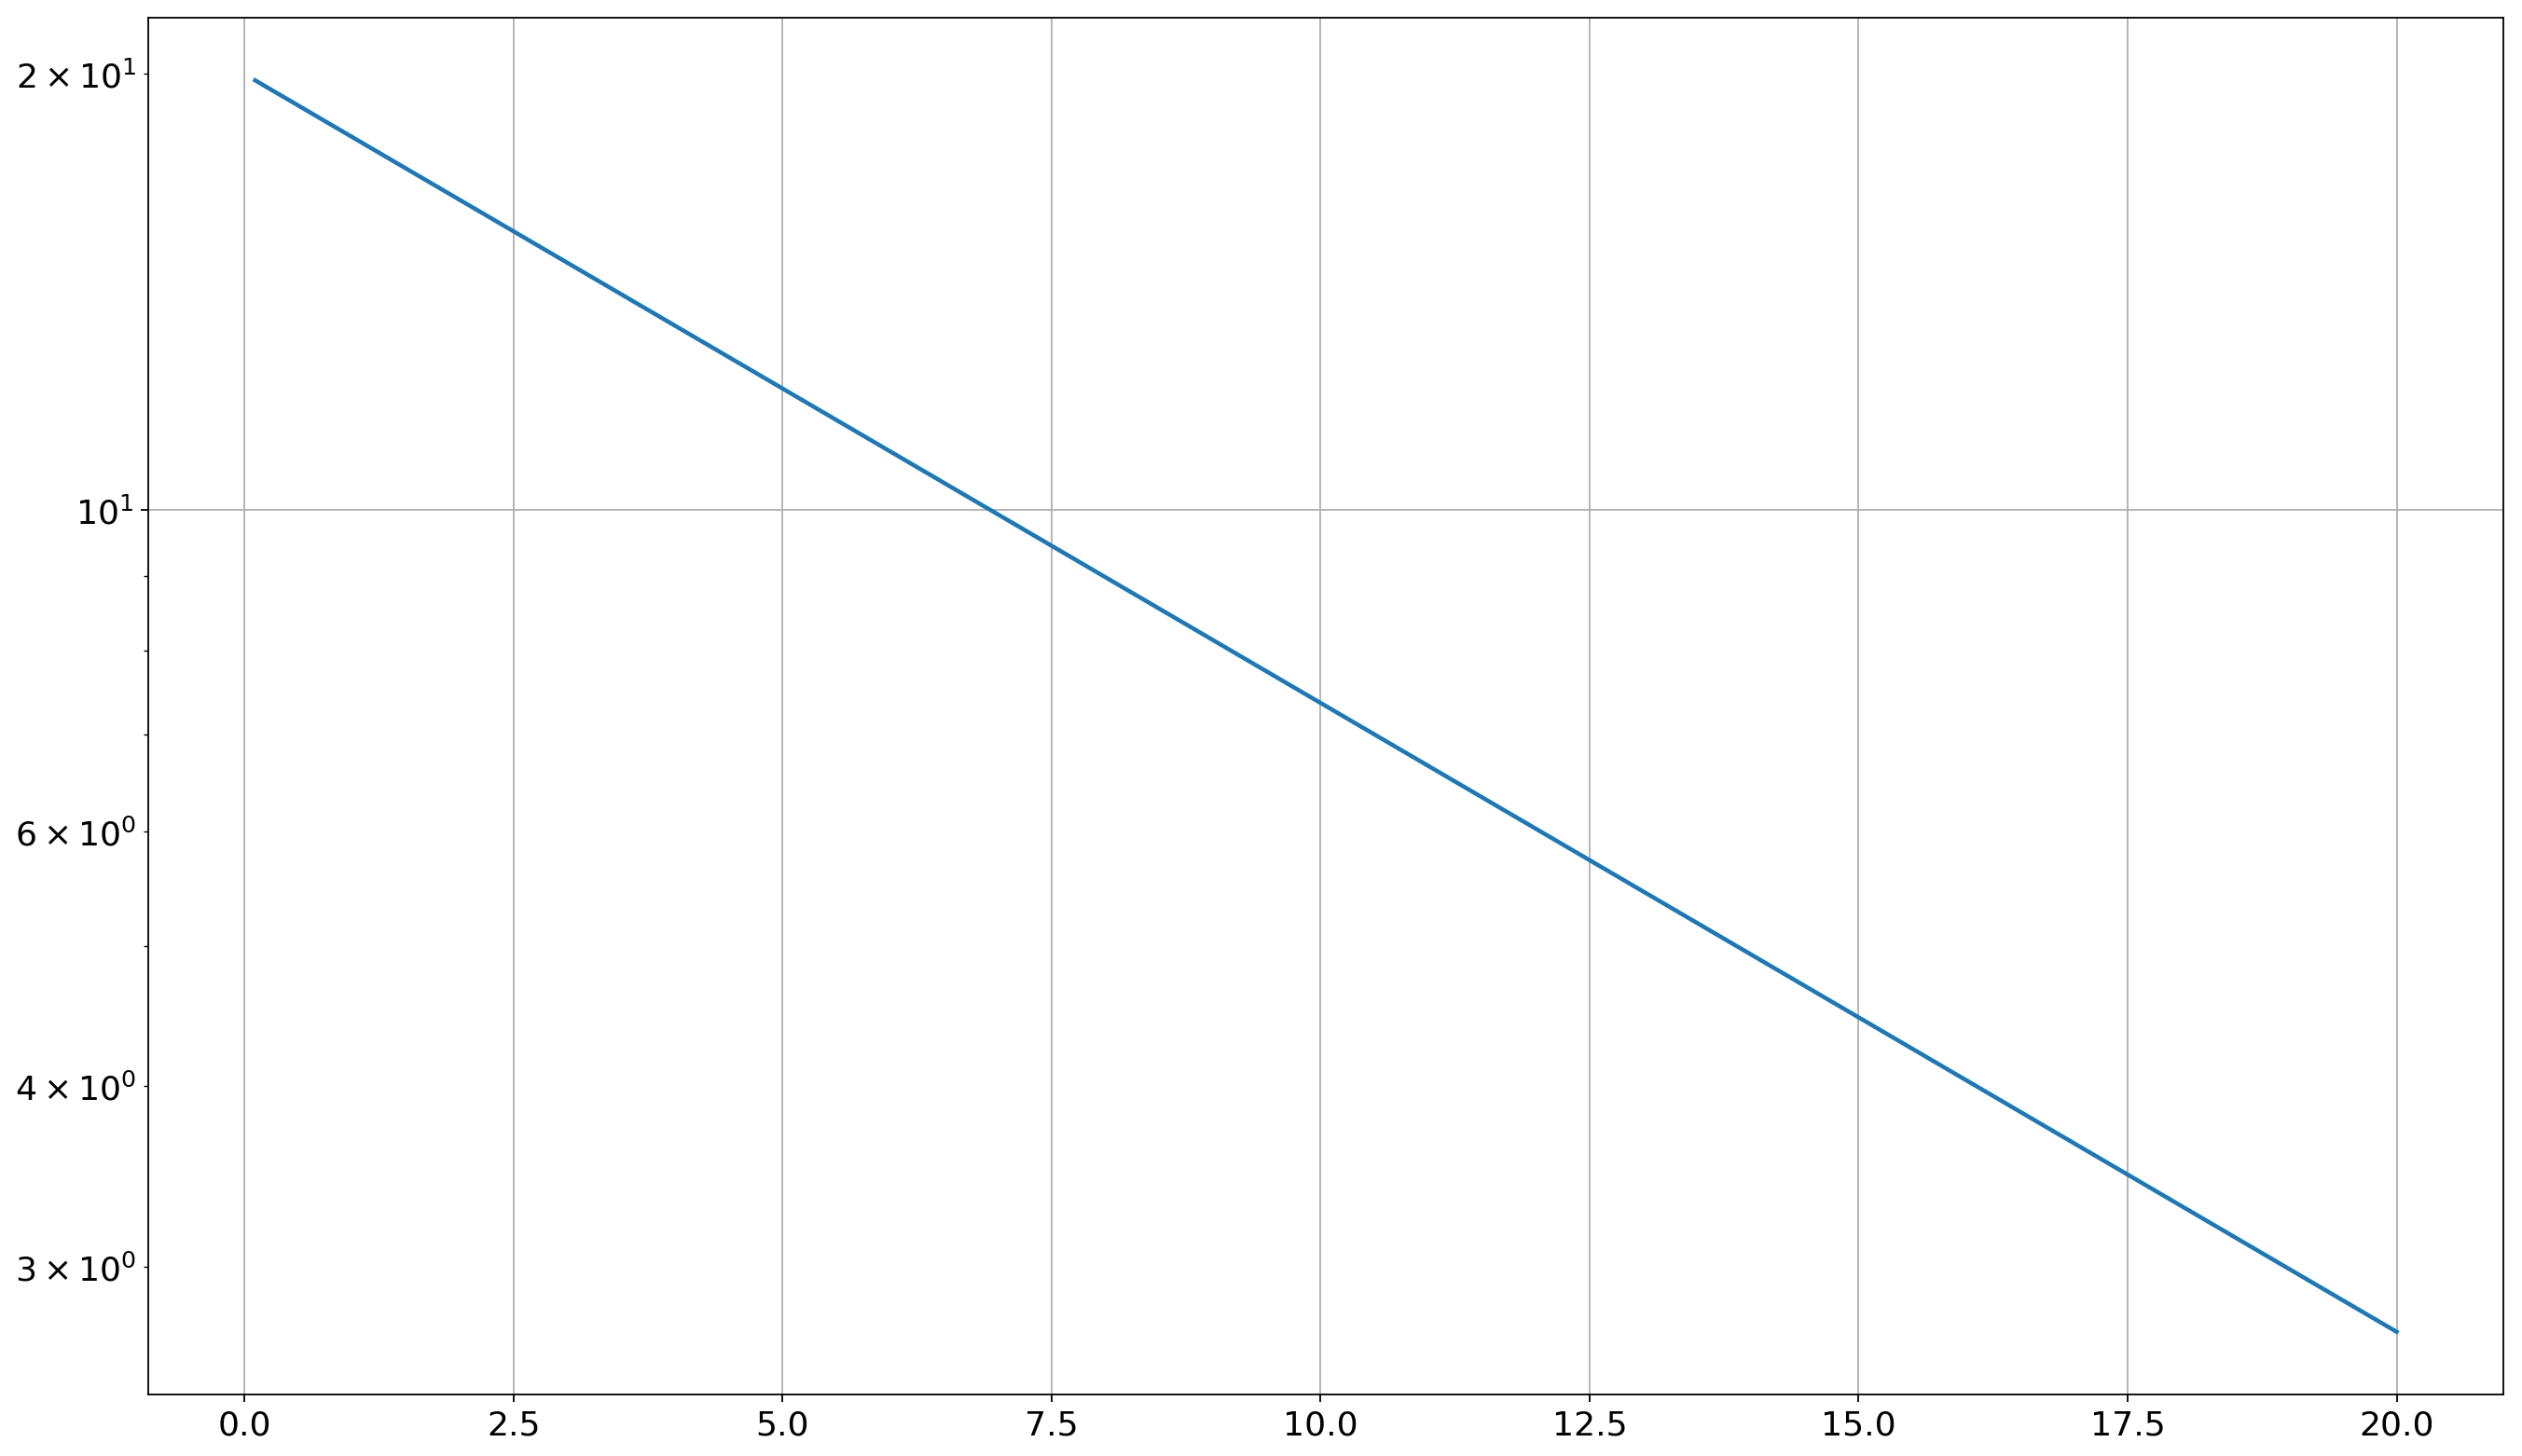
# Plot using semilogy
fig = plt.figure()
ax = fig.add_subplot(1, 1, 1)

ax.semilogy(x, y)

ax.grid()
plt.show()
# Plot using loglog
fig = plt.figure()
ax = fig.add_subplot(1, 1, 1)

ax.loglog(x, y)

ax.grid()
plt.show()