Saving a matplotlib figure with a high resolution
creating a matplotlib figure
#Importing matplotlib
%matplotlib inline
import matplotlib.pyplot as plt
import numpy as np
Drawing a figure
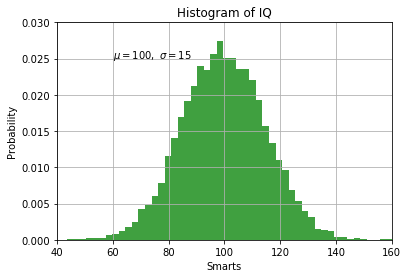
# Fixing random state for reproducibility
np.random.seed(19680801)

mu, sigma = 100, 15
x = mu + sigma * np.random.randn(10000)

# the histogram of the data
n, bins, patches = plt.hist(x, 50, normed=1, facecolor='g', alpha=0.75)


plt.xlabel('Smarts')
plt.ylabel('Probability')
plt.title('Histogram of IQ')
plt.text(60, .025, r'$\mu=100,\ \sigma=15$')
plt.axis([40, 160, 0, 0.03])
plt.grid(True)
plt.show()
Saving the figure
normally, one would use the following code
plt.savefig('filename.png')
<matplotlib.figure.Figure at 0x2e45e92f400>
The figure in then exported to the file "filename.png" with a standard resolution. In adittion, you can specify the dpi arg to some scalar value, for example:
plt.savefig('filename_hi_dpi.png', dpi = 300)
<matplotlib.figure.Figure at 0x2e462164898>